

Chart Patterns Cheat Sheet for Traders
📊 Master common chart patterns in trading with our clear cheat sheet! Learn how to spot continuation & reversal signals to trade smarter & boost profits.
Edited By
Emily Clarke
Trading on the Nairobi Securities Exchange (NSE) or any other market requires more than just gut feeling; it demands sharp analysis. One of the key tools in a trader’s kit is recognising trade chart patterns. These patterns help predict potential price movements by showing how traders behave in certain situations.
Chart patterns form when price data, such as opening, closing, highs, and lows, create shapes that repeat over time. Understanding these shapes allows you to anticipate the next move, whether the price will rise, fall, or consolidate. Kenyan traders using platforms like EABL shares on NSE or even forex with brokers like HF Markets will find chart patterns especially useful for timing entry and exit points.

By studying chart patterns, traders can:
Identify trends and reversals early
Spot continuation moves to ride profits
Set logical stop-loss and take-profit levels
Reduce guesswork by basing decisions on price action
For example, a head and shoulders pattern appearing on Safaricom’s daily chart could signal a coming drop, prompting you to sell or short before losses deepen. Conversely, a rising triangle on the same stock might hint at a strong upward breakout.
Consistently spotting reliable chart patterns improves decision-making and can boost your trading confidence in Kenya’s dynamic markets.
Most online trading platforms available in Kenya offer interactive charts with candlestick views. Look closely at how price swings form swings (highs and lows). Simple patterns like double tops, flags, and triangles are good starting points.
Keep in mind, no pattern guarantees outcomes but combined with volume and market context, they become powerful clues. For instance, checking volume spikes during breakouts on NSE shares helps confirm moves.
Start by focusing on daily or weekly charts; they show clearer patterns than minute-by-minute data.
Use Kenyan stocks you know well to observe repeated formations.
Combine pattern recognition with basic indicators like moving averages for confirmation.
Understanding chart patterns is a critical skill for any Kenyan trader looking to sharpen strategy and trade smarter. With practise, identifying these shapes becomes second nature, helping you stay one step ahead in the markets.
Trade chart patterns offer a visual snapshot of how prices have moved over time in financial markets. For Kenyan traders, these patterns are not just abstract shapes but practical tools to make sense of market behaviour on platforms like the Nairobi Securities Exchange (NSE) or forex trading apps.
At their core, trade chart patterns are formed by connecting price points on a chart over specific time frames. This results in shapes like triangles, flags, or head and shoulders that describe how prices fluctuate, stall, or reverse. For example, when viewing the price movements of KCB Group stock over weeks, these patterns can highlight whether the price is consolidating or gearing up for a breakout.
The visual appeal helps traders quickly grasp momentum shifts without having to dive into complex calculations. Kenyan traders using platforms that show candlestick or line charts can identify these patterns to see where the price might head next.
Patterns reflect how traders collectively respond to market events such as earnings reports or macroeconomic news like Central Bank of Kenya (CBK) interest rate decisions. When many investors buy or sell at particular price points, this creates recognizable shapes on the chart, indicating areas of support (price floor) or resistance (price ceiling).
This collective behaviour is crucial because it suggests likely future movements. For example, a double bottom pattern on Safaricom shares may signal strong buying interest at a certain level, hinting at a possible price rebound.
Trade chart patterns help anticipate whether an asset’s price will continue moving in the current direction or reverse. Continuing trends often appear in patterns like ascending triangles – where prices create higher lows, tacitly suggesting increasing buying pressure.
For traders on NSE or forex markets involving the Kenyan shilling (KSh), spotting these can guide tactical decisions, such as entering a trade before a confirmed breakout or avoiding positions during consolidation.
Using chart patterns sharpens entry and exit strategies by highlighting where price moves often stall or reverse. Traders apply stop-loss orders just outside pattern boundaries to limit potential losses if the market goes against their bet.
For instance, when trading coffee futures, recognising a head and shoulders pattern can prompt exiting before prices fall sharply. Similarly, a breakout above a pattern’s resistance level can serve as a trigger to enter a new long position. These insights are especially useful for Kenyan traders new to technical analysis, offering clearer, disciplined rules rather than guesswork.
Understanding trade chart patterns bridges the gap between raw market data and actionable decisions. They decode market psychology, helping you trade smarter and manage risk effectively, whether dealing in NSE equities, forex, or commodities.
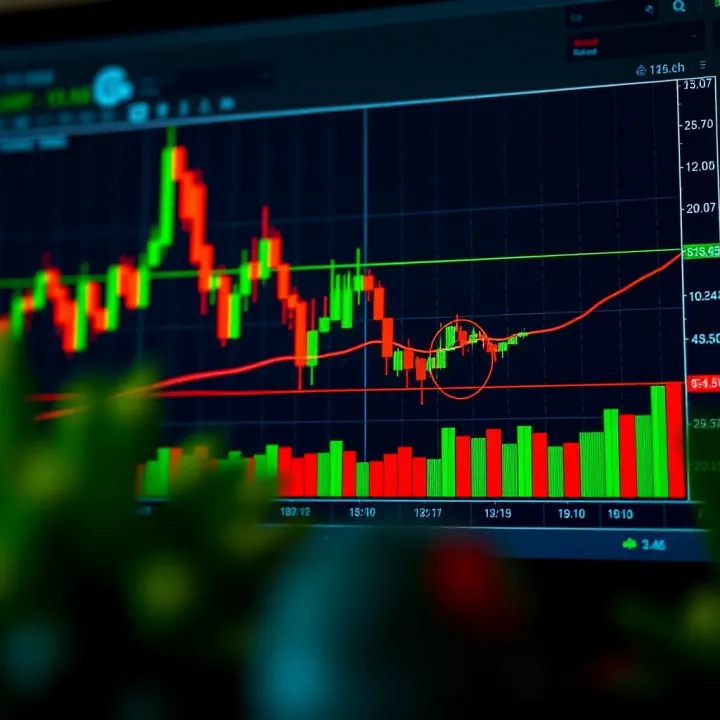
By mastering these concepts, Kenyan traders improve their ability to read market clues, making their trades more informed and potentially more profitable.
Understanding the main types of trade chart patterns helps Kenyan traders spot likely market moves. Patterns fall into three broad categories: continuation, reversal, and neutral. Each carries distinct signals about price direction, letting you tailor your strategy to local market behaviour, whether trading NSE stocks or forex via M-Pesa platforms.
Triangles (ascending, descending, symmetrical) signal whether the prevailing trend will continue. An ascending triangle forms when buyers push prices higher but sellers hold firm at a resistance level. This suggests rising demand – a Kenyan trader might watch an NSE stock breaking this pattern upward as a signal to buy. Descending triangles point to selling pressure, often seen when commodity prices dip during slower seasons, like tea prices before harvest.
Symmetrical triangles, where price swings tighten between converging trendlines, signal market indecision before a breakout. For instance, forex pairs like USD/KES often form these during consolidation before strong moves.
Flags and Pennants are short-term patterns that show brief pauses in a strong trend. A flag looks like a small rectangle slanting against the trend, while a pennant forms a tight triangle. Both suggest the current movement – up or down – will resume soon. For example, during bullish runs in NSE shares like Safaricom, flags may appear as short pauses before prices surge further. These patterns help traders plan quick entries or exits with minimal risk.
Head and Shoulders is one of the most reliable reversal signals. It shows three peaks: a higher middle (head) flanked by two lower shoulders. When price breaks the neckline after the right shoulder, it often signals a trend flip. Kenyan investors have spotted this in NSE tech stocks before sell-offs, helping minimise losses. The inverse pattern predicts a rise after a downtrend.
Double Top and Double Bottom patterns occur when price hits the same high or low twice but fails to break through. A double top hints at a coming downtrend, while a double bottom suggests a rebound is near. For instance, during periods of uncertainty in forex markets, such as USD/KES, these patterns can alert traders to prepare for potential reversals.
Rectangles form when price moves sideways within clear support and resistance levels. This sideways channel shows balance between buyers and sellers. Traders often wait for a breakout to indicate the next big move. Kenyan commodities, like coffee prices on global exchanges, may experience rectangle phases during off-season periods.
Consolidation phases describe slow price action where volume and volatility decrease. This usually happens before a significant jump or drop. Recognising consolidation on charts helps Kenyan traders avoid rash decisions and prepare for impending moves, especially in volatile sectors such as energy stocks.
Mastering these key patterns builds a strong foundation for reading charts wisely, helping you time trades confidently and manage risks effectively in Kenyan markets.
Summary: These basic types transform raw price charts into useful guides. Triangles and flags point to trend continuation, head and shoulders or double tops/bottoms warn of reversals, while rectangles and consolidation phases highlight pauses in price action. Spotting these in local NSE or forex markets lends Kenyan traders an edge in anticipating and reacting to price moves wisely.
Reading and confirming chart patterns is a key skill for any Kenyan trader looking to improve their timing and decision-making. Understanding how to spot a pattern on your trading platform and knowing when it is reliable can protect you from false signals and help you enter or exit trades with confidence. The process isn’t just about recognising shapes but also confirming them with additional tools so you don't get caught on the wrong side of the market.
Most Kenyan traders use platforms like Euronext Nairobi via brokers or mobile apps such as EABL’s and I&M Capital’s trading apps. These tools offer charting options that display price movements in candlesticks or line charts, where patterns become visible. Being familiar with the functions of your chosen platform matters—a feature like zooming in on short-term trends or switching between time frames (daily, weekly) helps reveal different pattern structures.
For example, when tracking Safaricom’s shares on a mobile app, zooming into a one-hour chart may reveal a triangle pattern indicating a potential breakout. These platforms often provide tools to draw trend lines or mark support and resistance levels, which are essential for spotting patterns accurately.
The shape of a pattern and the volume behind it give clues about strength or weakness. Common shapes like head and shoulders, double tops, or triangles are easier to spot when price action forms clear highs and lows that follow a pattern’s outline. Volume is vital—for instance, an increase in volume during a breakout affirms that the move is likely genuine.
If you notice a descending triangle forming on KCB Group’s stock with falling volumes during the pattern but then a sudden volume spike on a breakout below support, that's a strong sell signal. Kenyan traders should pay attention to these clues to avoid acting on patterns that lack confirming activity, which could otherwise lead to losing trades.
Volume acts as a reality check for patterns. A break above or below a pattern’s boundary on increased volume confirms participation by many traders, ensuring the price signal is authentic. Low volume breakouts often fail, causing price to reverse soon after.
In Kenya’s NSE market, volume confirmation has helped traders avoid false signals during events like earnings releases for companies such as KPLC or Equity Bank. Without volume support, a breakout can look convincing on the chart but lacks momentum behind it.
Moving averages smooth out price noise and help confirm trend direction related to a pattern. For instance, if a price breaks out of a rectangle pattern and crosses above the 50-day moving average, this usually supports a bullish move.
Oscillators like the Relative Strength Index (RSI) or Moving Average Convergence Divergence (MACD) provide insight into market momentum. An RSI rising above 50 during a breakout indicates strengthening buying pressure, which can validate the trade setup. Kenyan traders combining pattern recognition with these indicators often achieve more reliable signals and better timing.
Taking time to not just identify but also confirm chart patterns using volume and technical indicators keeps your trades rooted in real market behaviour. This approach reduces guesswork and makes your trading decisions sharper and more disciplined.
In summary, reading and confirming chart patterns means more than seeing shapes on a screen. Using Kenyan trading platforms effectively, recognising pattern shapes and volume dynamics, alongside tools like moving averages and oscillators, helps you confirm whether a pattern signals a real opportunity or a trap. That way, you trade smarter, not just harder.
Using chart patterns effectively shapes trading strategies. Recognising when to enter or exit trades based on these patterns can improve timing and profitability. For Kenyan traders dealing with NSE stocks, forex, or commodities, applying chart patterns sharpens decision-making and risk control, crucial for the often-volatile markets.
Entry and exit points often hinge on breakouts or breakdowns from key patterns. For example, an ascending triangle suggests a potential upward breakout. A trader watching Safaricom shares on the NSE might wait for the price to breach the triangle’s resistance before buying, signalling momentum. Conversely, a breakdown in a descending triangle signals a sell-off. This approach helps Kenyan traders avoid premature entries, increasing chances of riding meaningful price moves.
Stop-loss orders protect capital by limiting losses when the price moves against the trade. Incorporating stops around pattern signals is vital. For instance, after buying on a breakout, setting a stop-loss just below the pattern’s breakout point can reduce losses if the breakout fails. A trader in forex dealing with USD/KES could set a stop-loss after a confirmed head-and-shoulders reversal to limit exposure. This method reinforces discipline and manages risks in fast-moving markets.
Chart patterns often provide price targets based on their size or range. For example, in a double bottom pattern seen in a tea commodity price chart, the expected price rise can equal the height between the bottoms and the peak. Kenyan traders can use such measurements to estimate realistic exit points, making profit-taking systematic rather than guesswork. This aids in planning trades with clear reward-to-risk ratios.
More established or confirmed patterns warrant larger positions, while weak or uncertain set-ups suggest smaller trade sizes. If a trader spots a strong bullish flag on an NSE stock with solid volume confirmation, increasing trade size makes sense. However, if the pattern is less clear or forms in low volume, cautious, smaller position sizes reduce risk of losses. Tailoring trade size to pattern reliability helps traders protect capital and optimise returns.
Applying chart patterns is not about following signals blindly but integrating them into a broader, disciplined trading system that suits your risk tolerance and market knowledge.
By understanding and applying these principles, Kenyan traders can improve timing, control risk, and make better-informed trades in local and international markets.
Seeing trade chart patterns in action within Kenyan markets makes the concept more practical and relatable. It shows how these patterns influence real trades, helping traders understand price moves specific to local assets. From stocks to commodities and forex, recognising familiar patterns can improve decision-making and timing.
The NSE has seen various chart patterns shape stock prices over the years. For example, stocks like Safaricom PLC and Equity Bank have shown classic head and shoulders and double bottom patterns that preceded notable price reversals. In 2019, Safaricom’s stock formed a symmetrical triangle before breaking out sharply, signalling to traders a potential surge. Such historical examples provide a practical guide on what to watch for when analysing NSE shares.
Recent years have seen more Kenyan investors actively using chart patterns before making trades. During the Covid-19 pandemic, several traders spotted ascending triangle patterns in stocks like KCB Group, indicating a likely upward trend despite the market uncertainty. These insights helped them enter positions ahead of price rallies. Locally available apps like NSE Mobile Trader and Cooperative Bank’s trading platform often include charting tools, making it easier for everyday investors to spot patterns and act early.
Though M-Pesa is primarily a mobile money platform, price trends in related forex pairs like USD/KES (US dollar to Kenyan shilling) show clear chart patterns such as flags and pennants. Traders use these to anticipate currency strength or weakness, which affects fluctuations in M-Pesa transaction volumes and fees. Recognising these patterns helps forex traders on platforms like HotForex Kenya to time currency purchases or sales more effectively.
Kenyan coffee and tea prices follow seasonal trends that often form recognizable chart patterns. For instance, during the peak harvesting months, prices tend to form consolidation rectangles as supply tightens, then breakout seasons reflecting demand changes. Coffee exporters and traders watch for double bottom patterns signalling potential price recoveries after dips. Understanding these cycles and patterns supports better timing in commodity selling, crucial for farmers and exporters managing income flows.
Mastering chart patterns within Kenyan markets provides traders with valuable local context. It moves theory into action, showing real opportunities and risks in stocks, currency, or commodities traded right here.
This hands-on familiarity is what makes chart pattern knowledge an asset rather than just a textbook theory for Kenyan traders.
📊 Master common chart patterns in trading with our clear cheat sheet! Learn how to spot continuation & reversal signals to trade smarter & boost profits.

📈 Explore binary trading basics, risks, and strategies tailored for Kenyan traders. Learn legal tips and how to manage assets confidently in Kenya.

📊 Master forex chart patterns to spot market moves and boost your trading strategy. Learn common patterns and tips for smarter decisions in Kenyan markets.

📈 Understand key trading chart patterns to spot trends and manage risks. This guide equips Kenyan traders with practical skills for both local and global markets.
Based on 10 reviews