

Guide to Chart Patterns with Free PDF Downloads
📊 Master key chart patterns used in trading! Discover how to spot them and access free PDFs for better technical analysis—perfect for Kenyan traders and investors.
Edited By
James Wilson
Chart patterns have been a trusted tool for traders across the world, including markets here in Kenya. These patterns visually represent the battle between buyers and sellers and can indicate potential price movements. Understanding these can give you an edge when deciding when to enter or exit trades.
Not all chart patterns bring the same results. Some, like the Head and Shoulders or the Double Bottom, have shown higher success rates in signalling trend reversals. Others, such as Triangles and Flags, often indicate continuation of the current trend. Recognising these differences can improve your trading accuracy substantially.

Remember, chart patterns reflect market psychology. They show traders’ hopes, fears and indecision at specific price levels.
Here are some key facts about the most profitable chart patterns:
Head and Shoulders: Signals a reversal from bullish to bearish trend or vice versa. It is quite reliable when confirmed with volume indicators.
Cup and Handle: Typically indicates bullish continuation, often seen before a strong break upwards.
Double Tops and Bottoms: Mark strong support or resistance zones and hint at reversals when confirmed.
Triangles (Symmetrical, Ascending, Descending): Usually continuation patterns, useful in both trending and sideways markets.
Integrating these chart patterns into your strategy calls for disciplined observation and confirmation by other technical tools like volume, moving averages, or oscillators. Planning your trades around patterns with good risk-to-reward ratios can safeguard you from unnecessary losses.
Practical tip: Always verify a pattern with price action and trade volume before making a move. A pattern alone is not a guarantee but a useful signal when combined with other indicators.
This guide will walk you through spotting and applying these profitable patterns in your trading toolkit, helping you make better-informed decisions. You will also get access to downloadable PDFs to practice pattern recognition and log your trade outcomes efficiently.
Chart patterns are essential tools in trading because they help you spot potential price movements based on historical trends. Recognising these patterns can give traders an edge by signalling when to buy or sell before price changes become obvious. For instance, spotting a rising wedge on a stock chart might warn you of an impending price drop allowing you to protect your investment early.
Understanding how chart patterns work is particularly important for traders in different markets, whether equities, forex, or commodities. Each market shows price movements shaped by traders’ behaviour, and chart patterns capture these collective actions visually. The patterns simplify complex price data into understandable shapes, making it easier to predict what might come next.
Chart patterns are distinct shapes that price movements create on a chart over time. They form when prices swing up and down within particular boundaries, revealing a readable formation. These patterns are not random but rather reflect how market participants react to various factors like news, supply and demand, or economic indicators. For example, a “double top” pattern looks like the letter ‘M’ and suggests the price has hit a resistance level twice before dropping.
These shapes work as signals because they reflect trader psychology: fear, greed, optimism, or hesitation. When many traders recognise the same pattern, their actions reinforce the move, making the pattern reliable for predicting future price changes.
Chart patterns give clues about where prices might head next by showing probable trend continuation or reversal. Take the “head and shoulders” pattern: it usually predicts a trend reversal from bullish to bearish. When price forms a peak (the head) between two smaller peaks (shoulders), it suggests buyers are losing strength.
Traders use patterns alongside volume data or other indicators for confirmation, helping reduce the risk of false signals. For example, a pennant pattern appearing after a big price rise often hints at a short pause before the uptrend continues. This insight allows traders to set timely entries or exits, managing risk better.
Several chart patterns recur frequently and matter to profitable trading decisions. Among the most popular are:
Head and Shoulders: Marks potential trend reversal points.
Double Tops and Bottoms: Indicate strong resistance or support levels.
Cup and Handle: Suggests a continuation of an upward trend after a brief consolidation.
Flags and Pennants: Small consolidation patterns that hint at trend continuation after a sharp move.
By familiarising yourself with these patterns and the conditions under which they work best, you’ll improve your ability to anticipate moves rather than just reacting to them. Practising pattern recognition sharpens your eye and helps you trust your analysis.
Recognising chart patterns is like learning a language that the market speaks. Once you understand it, you’ll catch signals early and trade smarter, not harder.
In summary, understanding chart patterns equips you with a practical method to decode price action, making your trading decisions more informed and potentially more profitable.
Recognising key chart patterns is vital for any trader serious about improving their decision-making. These patterns often signal shifts in market momentum, helping traders spot entry or exit points with greater confidence. While no pattern guarantees success, certain well-documented ones tend to appear frequently across assets and timeframes, making them especially useful.
The Head and Shoulders pattern is popular for signalling a trend reversal. It typically forms after a strong uptrend, marking a shift towards bearish momentum. Traders look for three peaks: a higher peak in the middle (the head) flanked by two lower peaks (the shoulders). A break below the "neckline" connecting the shoulders indicates the trend is likely to reverse, often prompting sellers to act. For example, in Nairobi Securities Exchange (NSE) shares, spotting this pattern helped some traders cut losses early in 2023's market dip.
Double Tops and Double Bottoms are straightforward reversal patterns that signal exhaustion in current trends. A Double Top occurs when price hits a resistance level twice without breaking higher, often followed by a drop. Conversely, a Double Bottom forms when price tests support twice without falling lower, suggesting a bounce back is likely. In practice, Kenyan forex traders use these patterns to predict currency moves, such as the USD/KES pair's rally after hitting a double bottom.
The Cup and Handle pattern resembles a teacup, where the price forms a rounded bottom (the cup) followed by a slight pullback (the handle). This pattern typically signifies a bullish continuation. It's more common on daily or weekly charts where the asset consolidates after a rise. For locally traded stocks like Safaricom, this pattern has indicated moments to buy ahead of price climbs.
Flags and Pennants represent short-term pauses in a strong trend before continuation. A Flag appears as a rectangular consolidation angled against the prevailing trend, while a Pennant looks like a small symmetrical triangle. These patterns often last only a few days, making them great for traders looking for quick moves. For instance, in the Kenyan agricultural commodities market, price flags have alerted traders to breakouts during harvest seasons.
Successful trading depends on recognising these patterns with precision and confirming them using volume or other indicators. Patterns alone cannot guarantee profits but serve as valuable guides within a broader trading strategy.
Understanding and applying these four key chart patterns can boost your trading edge across markets, whether dealing with equities, forex, or commodities in Kenya and beyond.
Having reliable PDF resources at hand can make understanding and applying chart patterns much easier. PDFs often present concise, well-organised information that you can refer to anytime, without needing internet access. This is especially helpful when you are on the go, maybe travelling to a trading seminar in Nairobi or reviewing strategies during a matatu ride, where connectivity might be patchy.
PDF guides offer several advantages for traders and investors alike. First, they serve as a quick reference, allowing you to revisit pattern definitions, key characteristics, and example charts without searching through multiple sites. For instance, a PDF with annotated diagrams of head and shoulders or cup and handle patterns can clarify where to spot entry and exit points clearly.
Furthermore, PDFs are often printable, which means you can keep a physical copy near your workspace or in your trading journal for easy consultation. This reduces screen fatigue and encourages more active learning by allowing you to make notes or highlight sections directly on the pages. Another upside is that some PDFs include step-by-step guides or checklists that help structure your analysis, improving your overall trading discipline.
Most reputable trading platforms and financial websites provide downloadable PDFs covering chart patterns, technical analysis, and trading strategies. These are usually crafted by experienced traders or analysts and updated regularly to reflect current market behaviours. On platforms like Thinkorswim or TradingView, you might find handy PDFs that discuss pattern nuances specific to equities, forex, or commodities.
These PDFs are practical because they not only explain the theory but often include real-time examples or case studies from recent market sessions, making the learning experience grounded in actual market action.
Institutions offering finance or investment courses often supply study materials in PDF form. Universities and colleges with commerce or finance departments might have digital resources available through their libraries or e-learning portals. These PDFs tend to be more detailed and academically rigorous, giving you a solid foundation on the statistical and psychological aspects behind chart patterns.
Books translated into PDF format, especially those by Kenyan authors or international experts accessible through local bookstores, also provide trustworthy information. For example, a PDF version of "Technical Analysis of the Financial Markets" by John Murphy is commonly recommended for deeper study.
Active trading groups, both online and offline, can be great sources for curated PDFs. These communities often share resource packs that include pattern charts, cheat sheets, and trading journals contributed by members who have gathered practical knowledge from their own experience.
Forums on platforms like Reddit or specialised Facebook groups can connect you to PDFs tailored for local markets or regional trading habits, offering insights that global generic PDFs might miss. Just be cautious about the credibility of these files – always cross-check with reputable sources to avoid outdated or incorrect information.
Simply having a PDF won't sharpen your skills unless you actively engage with the material. Start by reading through the patterns and trying to draw them yourself on historical charts from your preferred markets. Then, test your recognition by observing live charts during market hours, marking where a pattern forms or fails.
Use the checklists or step guides found in some PDFs to verify pattern validity. Compared to relying solely on memory, this structured approach reduces errors in pattern interpretation. Also, combine insights from PDFs with other tools like moving averages or volume indicators to confirm signals before making trades.
Remember, PDFs should complement—not replace—practical experience and ongoing learning. Regularly update your resources and keep reviewing past trades using the knowledge from your PDF collection to identify what worked and what did not.
In summary, well-chosen PDF resources provide an invaluable knowledge base, enabling you to refer back, practise, and build confidence in spotting profitable chart patterns reliably.
Chart patterns play a significant role in trading by offering visual cues that help traders spot potential price movements. They provide an accessible way to assess market sentiment and possible future trends. That said, recognising the strengths and limitations of these patterns ensures you use them wisely rather than blindly.
Visual clarity and straightforward interpretation make chart patterns a popular choice for many traders. The shapes they form—like triangles, head and shoulders, or double tops—are easy to identify on a price chart. For example, a clear head and shoulders pattern visually signals a potential trend reversal without needing complex calculations. This clarity means both beginners and experienced traders can quickly interpret market directions just by looking at the chart.
Moreover, visual patterns help reduce the overwhelming data into something manageable. Trading platforms used in Nairobi or Mombasa allow quick chart scanning, enabling traders to make timely decisions during busy market hours. This practicality makes chart pattern analysis a go-to tool for many investors juggling multiple assets.
Chart patterns also help identify potential market trends before they fully develop. Seeing a cup and handle forming on a daily price chart, for instance, can suggest an upcoming bullish move. Traders can prepare by setting alert points or entry orders around the breakout levels. This foresight often allows catching price moves early, which could translate to better profits.
Such trending insights aid decision-making across asset classes—from stocks listed on the Nairobi Securities Exchange to forex pairs popular with Kenyan traders. The patterns act as signals that markets may shift direction, helping traders align their strategies accordingly.
Another strong point is that chart patterns are useful across different markets and timeframes. Whether you analyse short-term 15-minute charts or monthly charts for long-term investments, these patterns still apply. This flexibility means one can use the same recognisable patterns while trading in equities, commodities, or currencies.
For instance, a double bottom pattern on the 4-hour chart of an NSE stock like Safaricom might indicate a strong support level, while the same pattern on a daily Forex chart alerts to currency strength. This cross-market utility adds tremendous value for traders who diversify their portfolios.
Despite their benefits, chart patterns are prone to false signals and misinterpretation. Sometimes what looks like a triangle breakout could be a temporary price spike caused by low liquidity or news events, leading to losses if acted on prematurely. For example, a false double top on a high-volume NSE stock might tempt a trader to exit too soon, missing out on a subsequent rally.
Mistaking random price movements for valid patterns is a common trap, especially with markets as dynamic as Kenyan equities or forex. Thus, relying solely on visual patterns can be risky.
Another limitation is that chart patterns need confirmation with other indicators to improve accuracy. Using volume indicators, Relative Strength Index (RSI), or moving averages alongside patterns offers stronger signals than patterns alone. For example, confirming a cup and handle breakout with rising volume gives more confidence that the trend is genuine.
Traders often combine chart patterns with technical tools to filter out noise. This layered approach reduces wrong trades and protects capital.
Lastly, market unpredictability and external factors can undermine chart patterns. Unexpected news like CBK interest rate changes or political developments can render pattern predictions useless. A pattern may suggest an uptrend, but a sudden regulatory announcement might push prices the other way.
External factors mean that no pattern guarantees success. Traders must stay alert and ready to adapt to rapidly changing conditions, especially in volatile markets such as Kenyan currency pairs or government bonds.
Chart patterns are valuable tools but work best when combined with other analysis and good risk management. Understanding their advantages and limits helps traders avoid costly mistakes and trade with more confidence.
Chart patterns offer valuable clues about market sentiment and potential price movements. However, relying on them alone can be risky. Integrating chart patterns into a broader trading strategy strengthens decision-making and improves the chances of profitable trades. Traders in Kenya and beyond can benefit from combining patterns with other analysis tools, setting clear entry and exit rules, and managing risks effectively.
Chart patterns should be viewed as one piece of the puzzle. For example, pairing a double bottom pattern with volume analysis helps confirm if buyers are genuinely stepping in. Similarly, using moving averages or the Relative Strength Index (RSI) alongside patterns can verify trend strength or highlight overbought/oversold conditions. When a flag pattern appears during a strong uptrend confirmed by moving average crossover, the chance of continuation is higher.
No single indicator is foolproof, so blending chart patterns with oscillators, support and resistance levels, and fundamental data leads to more informed trades. For instance, before acting on a cup and handle pattern on Safaricom shares, looking at quarterly earnings or sector news adds context that price patterns alone may miss.
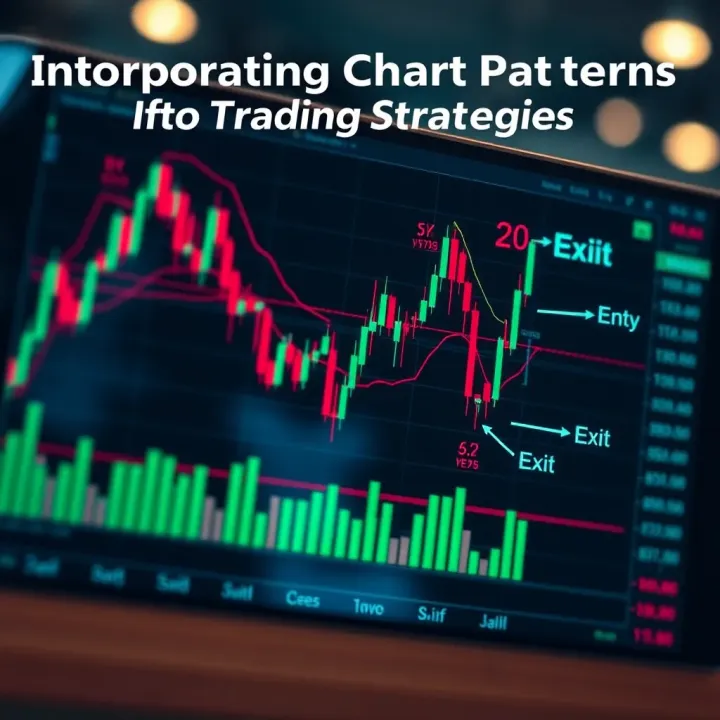
Chart patterns help define logical points to enter or exit trades. Consider the head and shoulders pattern: traders typically enter a short position once price breaks below the neckline, signalling trend reversal. A stop loss can be placed just above the neckline to limit losses in case of a false breakout.
On the flip side, a breakout from a bullish pennant can set an entry point, while a prior high or a measured move (the height of the flagpole added to the breakout point) can serve as a profit target. For example, a trader spotting a cup and handle on a stock listed on NSE can identify the handle’s breakout level as a trigger to buy and set targets based on the cup’s depth.
Clear entry and exit rules prevent emotional trading and provide structure.
Even the best patterns can fail; that means risk management must be part of any strategy. Position sizing depends on your risk tolerance and account size. For instance, risking 1-2% of your trading capital on any single trade helps protect against large losses.
Stop losses should be placed logically—not arbitrarily—to respect pattern boundaries. In the case of a double top, placing a stop slightly above the second peak safeguards capital if the pattern fails. Also, consider market volatility; avoid trading patterns during major news releases that might cause erratic price swings.
Regularly reviewing trades, including both wins and losses, helps refine your approach and avoid repeating mistakes.
Chart patterns are a valuable guide but pairing them with other tools, clear trade rules, and sound risk management improves your edge in trading.
In summary, integrating chart patterns into your trading strategy means more than spotting shapes on a chart. It involves combining multiple signals, planning your trades carefully, and protecting your capital as you navigate the markets. The practical benefit is higher confidence and consistency in your trading decisions.
📊 Master key chart patterns used in trading! Discover how to spot them and access free PDFs for better technical analysis—perfect for Kenyan traders and investors.

📊 Master forex chart patterns to spot market moves and boost your trading strategy. Learn common patterns and tips for smarter decisions in Kenyan markets.

📈 Learn how to spot and use key chart patterns for smarter trading in Kenya's markets. Avoid common mistakes and boost your strategy effectively.

📊 Master common chart patterns in trading with our clear cheat sheet! Learn how to spot continuation & reversal signals to trade smarter & boost profits.
Based on 10 reviews